
January 2019
Taken from the CBA Global Markets Research report, ‘January Month in Review’; first published on 1 February 2019
Summary: Financial Markets in January
Money markets showed elevated yields that have only contracted marginally in January.
Bonds have rallied (yields lower) in Australia as markets increased the chance rate cuts.
Global credit spreads retraced a good portion of the late 2018 widening, while A$ credit spreads remain on the sidelines and range bound.
Equities rose strongly in January after a battering in December. Materials and miners performed well as commodities rose.
The AUD was supported by higher commodity prices.
Money Markets (Cash)
The Australian data has been mixed over the past few months. And dwelling prices continue to fall. The bright spot is the labour market, where jobs growth remains strong and the unemployment rate is inching lower.
The Australian OIS rates have moved to price in an even greater chance of a rate cut in the coming year. However, these expectations remain more of a late 2019 or early 2020 story.
Australian and Global Fixed Interest
Across the developed market rates world, yields have finished near their lows in January. Markets have pushed back on the bounce in equity markets and have been firmly forward looking on a view that the rate hike cycle in the US has come to an end. As January closed, the more dovish Fed meeting justified the market pricing. The expected inversion of US rate curves has stalled for now. Carry trades may well move back in vogue given the Fed position.
This is also important for other markets. Global macro type trades have favoured a paid US rates vs received other markets. Cross market traded might start to lose favour given this new backdrop.
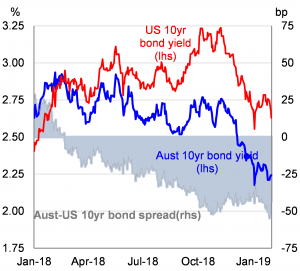
The US 2Y yield closed the month at 2.46% which was a rally (yields higher) of 2bp, though the range was a high of 2.616% and a low of 2.38% The US 10Y closed the month at 2.63% which was a rally (yields higher) of 5.5bp. The US curve finished the month modestly flatter, much of the move was undone in the last day as the curve steepened post FOMC. Front curves, which have been watched closely stayed in negative territory.
USD swap spreads, which have largely been benign in recent months, narrowed in the 10Y sector, flattening the spread curve.
In the Australian market, OIS pricing continued to lean against RBA views that the next move in policy rates will be higher. Further out of cycle rate hikes by the banks as funding cost increases were passed on as well as soft housing data are trumping the RBA’s optimism. Both labour force and CPI data did not provide a reason to consolidate pricing and indeed CPI reduced market pricing for cuts, albeit until the FOMC delivered its coup de grace.
Australian rates have also rallied (yields higher) and flattened once again. The 3Y physical bond has rallied (yields higher) 15bp to 1.7325%, while the 10Y physical has rallied 7.75bp to 2.2425%.
- Edit
- Edit
Chart 1: Australian vs US 10Y bond yields
Source: Bloomberg, CBA
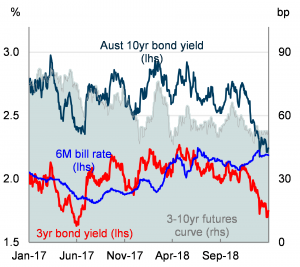
Chart 2 – Australian bond yields
Source: Bloomberg, CBA
Global Credit Markets (Cash)
January was dominated by the continued impasse on the funding of Trump’s wall between the US and Mexico and consequently all bar the last couple of days, the US government was shut for the month. A problem that may resurface given the temporary nature of the re-opening. Brexit and trade headlines continued to occupy the narrative, but the tactical impact on A$ credit appeared negligible. At month’s end the Fed released its latest statement, which carried with it a noticeably more dovish tone than previous statements.
January saw 44% of the S&P 500 reported Q4 results, with aggregate sales of +6.2% on the pcp and aggregate earnings of +13% on the pcp. Optically reporting season so far has seen solid growth numbers, however there has been pockets of stress surface, mainly on the back of bell-weather names disappointing, which gave markets moments for pause. Despite the persistent headlines and lack of tangible progress in the prevailing risk points, markets (risk) continued to rally nonetheless. The S&P 500 and DOW closing the month up around +7.9%, the strongest monthly gain in three years.
After a horrendous month or two of spread widening, January saw offshore credit spreads partially retrace lost ground. USD credit spreads outperformed EUR credit spreads by a factor of 4:1. USD Non-Financials ended the month -28 bps tighter compared to -6 bps tighter in EUR Non-Financials. It was a similar story in Financials, -24 bps vs -6 bps across USD and EUR respectively. A$ spreads also lagged, but A$ materially outperformed on the way out. While USD Non-Financial spreads were +50 – 70 bps wider over Q4’18, A$ Non-Financials were just +10 bps wider. On the January retracement, we’re seeing USD Non-Financials half way back to their prior inflection point, around the beginning of October 18. EUR Non Financials have retraced perhaps a third of their widening.
Equity Markets
After slumping in December, global sharemarkets began recoveries from their lows in early January with gains extending over the month. Investors continued to be fixated on developments in the US-China trade dispute as well as UK Brexit, US bank earnings reports and the US Government shutdown. Higher oil prices provided support for companies in the energy sectors.
In the first week of January, global markets were mixed in volatile trade. The US Dow Jones slumped 660 points on January 3 after Apple’s first sales warning in 12 years. But the Dow rebounded 747 points on January 4 in response to data showing a 312,000 lift in US non-farm payrolls for December. US markets rose 0.5-1.6 per cent in the first week of January, and Europe also lifted (German Dax up 2 per cent) but the Australian ASX 200 fell 0.5 per cent.
In the second week, global sharemarkets posted healthy gains on optimism about US-China trade negotiations. And on January 10, US Federal Reserve chief Jerome Powell reiterated that the Fed can be patient on future rate hikes. The Dow rose on four of the five days, lifting 2.4 per cent while the ASX 200 was up by 2.8 per cent.
In the third week of the month, global markets posted more gains, generally between 1.5-2.0 per cent. The Dow Jones again rose in four of the five days, lifting 3 per cent, while the ASX 200 rose 1.8 per cent and the German Dax lifted 2.9 per cent. On January 15, the UK Parliament rejected the Brexit deal but Australian and US markets rose. Over the week shares in US global investment banks were generally higher in response to earnings results.
In the fourth week of January global sharemarkets were generally flat, except the UK FTSE, down 2.3 per cent on uncertainty about Brexit. US shares fell by between 1-2 per cent on January 22 as investors digested a downgrade in IMF economic growth forecasts and weaker Chinese economic data. But US shares rebounded the next day on good earnings data.
In the final four days of the month, (January 28-31) global sharemarkets were mixed. But on January 30, US sharemarkets posted solid gains in response to positive earnings results from Apple and Boeing and the rates decision from the Federal Reserve. The Fed left rates unchanged but pledged to be patient in deciding the next move in rates. The Dow rose 435 points or 1.8 per cent.
Over January, all major sharemarkets were higher. The US Dow Jones rose 7.2 per cent with the S&P 500 up 7.9 per cent and Nasdaq up 9.7 per cent. In Europe, the German Dax rose by 5.8 per cent and UK FTSE rose 3.6 per cent. And in Asia, Japan rose 3.8 per cent while the ASX 200 lifted 3.9 per cent – the best January gain in five years.
In January, all of Australia’s 22 sub-industry sectors posted gains except Banks (down 0.6 per cent). The Energy sector rose the most (up 11.5 per cent) from Software & services (up 9.3 per cent) and Consumer services (up 8.3 per cent). The Small Ordinaries out-performed, up 5.6 per cent, with big companies (ASX50) up 3.5 per cent and mid-cap stocks up 4.5 per cent.
Australian dollar
After the CAD, AUD was the strongest performing G10 currency in January seeing its trade-weighted index rise by 1.5%. Rising Australia commodity prices helped initiate the January move and would remain a consistent theme throughout. However the more important catalyst was a 4 January speech by the Fed Chairman Jerome Powell which appear to emphasise downside risks to US inflation.
AUD buying reached a peak on 11 January on growing optimism regarding US-China trade talks as US Treasury Secretary Mnuchin announced an official trade meeting for end-January. The AUD was also helped by a surprise improvement in December retail sales, and further comments from the Fed’s Clarida emphasising a more ‘patient’ policy approach.
AUD outperformance was not a one-way trade however. While played-down by the RBA monetary policy statement 8 January, investor concerns regarding the Australian property market were beginning to impact the policy rate outlook. Such concerns were confirmed by weaker investment and owner-occupied house lending on 12 January undermining AUD. Tumbling consumer confidence, US-China trade tensions, and weaker China data all added to the more AUD gloomy tone seeing AUD/USD reach a 3 week low on 24 January.
Thereafter however, iron ore’s rally, and growing fears of a more dovish Fed seeming to outweigh RBA policy concerns. Indeed AUD/USD ignored soft Q4 inflation, preferring instead focus on still stronger Iron prices and confirmation at the 31 January FOMC meeting that US rates were effectively ‘on-hold’ for now.
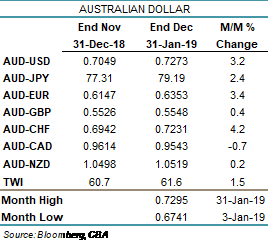
Table 1 – Australian dollar
Commodities
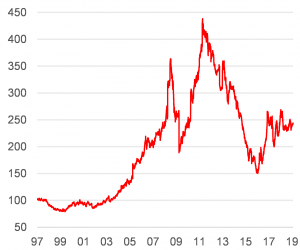
The CBA commodity price index decreased ~6.0% in January on the back of higher iron ore and oil prices.
CBA’s Terms of Trade (ToT) tracker indicates a ~3% increase in Australia’s ToT in QI, if spot AUD and commodity prices are maintained until the end of March. Given the tracker is using only one month of actual data, there are still notable risks associated with our forecast. Our tracker is pointing to a ~1‑1.5% q/q lift in Australia’s ToT in QIV.
Commodity prices finished mostly higher in January, led by iron ore and oil. Easing US-China trade tensions helped commodity prices generally, but commodity specific factors were particularly positive for iron ore and oil prices.
Iron ore prices rose sharply towards the end of last month following a tailings dam collapse at Vale’s Feijao mine in Brazil. While the mine only accounts for ~0.5% of the seaborne iron ore market, the ramifications could be larger. The company has already outlined plans to decommission 10 of its upstream tailings dams over three years, sidelining ~2.5% of the seaborne iron ore market in the process. However, Vale believes it has enough spare capacity to partially offset any lost output. Despite Vale’s guidance, markets are justifiably concerned that Vale’s iron ore production could remain lower for longer. Those concerns stem from the imminent response of Brazil’s regulators, who will take into consideration that the dam collapse at Feijao is the second such disaster Vale has been involved in since late 2015.
Oil prices outperformed other major commodities for most of January. Prices rose on demand hopes as US-China trade talks showed positive signs. However, oil prices also gained on evidence of ongoing compliance with the OPEC-led supply deal to sideline ~1.2% of global oil supply in 1H19. The most recent bullish data print was US oil imports from Saudi Arabia, which fell to the second lowest level since 2010 last week.
Coking coal was a notable underperformer last month. Subdued steel margins in China combined with weak buying and restocking demand before the Chinese New Year holiday (4‑10 February) were the major drivers.
Gold also saw a late rise in January. Prices gained sharply following the FOMC removed its policy guidance of “some further gradual increases” and replaced it with a statement that they will be “patient” in assessing its next change to the Funds rate. The dovish tone increases the appeal of gold relative to US-interest bearing securities.
Chart 3: CBA Commodity Price Index (USD)
Source: CommSec, Iress
Australian house prices
The CoreLogic data showed that dwelling prices continued to fall in January, with a 1.2% fall across the eight capital cities. Prices fell in seven out of the eight capital cities in the month, with Canberra the only capital city where prices rose (see Table below). It’s worth noting that sales volumes are seasonally low in January, so the prices data is little less reliable than normal.
Sydney and Melbourne experienced the largest price falls in January. The rate of decline in Sydney and Melbourne dwelling prices have picked up over the past three months.
Dwelling prices in Sydney are now off 12.3% from their peak in mid-2017, taking prices back to mid-2016 levels. The current Sydney downturn is now one of the largest experienced, with the size of the price fall only larger for the 1982 downturn. In Melbourne, prices are off 8.7% from the peak, taking values back to early-2017 levels.
The leading indicators of dwelling prices are pointing to further falls. Auction clearance rates are very low, the flow of credit has slowed to both owner-occupiers and investors, and foreign buyers have stepped back from the market. We expect further dwelling price falls this year, with prices in Sydney and Melbourne expected to drop by the most. We also expect small decline in Brisbane, Perth and Darwin in 2019.
Dwelling sales volumes are low which has implications for the broader economy. Firstly, low sales volumes and lower sales prices are reducing stamp duty revenues for the state governments. Secondly, lower sales volumes tend to reduce the amount that people spend on new furnishings, fittings and white goods. Growth in sales volumes has declined for these items and there is also heavy discounting in these goods as retailers try to keep their market share.
When we last heard from the RBA back in December they seemed fairly relaxed about how the dwelling price downturn was playing out, with the broader economy looking in good shape. Since then we have seen the labour market continue to improve but we are expecting only a modest rise in consumer spending in Q4 after a soft outcome the previous quarter. Our analysis here shows some tentative evidence of a negative wealth effect.
Next week’s RBA communication with provide an important update on their thinking related to the housing market. In particular, Wednesday’s speech by Governor Lowe and the Statement on Monetary on Friday will give the RBA chance to outline their views.
Chart 4 – Annual Dwelling Price Change
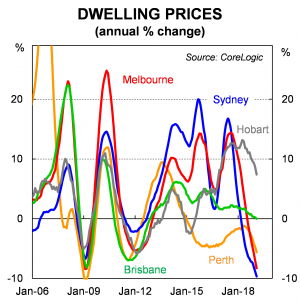
Table 2: CoreLogic Median Dwelling (Houses and Apartments) Prices – January 2019
| Sydney | Melbourne | Brisbane | |
| %chg mth | -1.3 | -1.6 | -0.3 |
| % ann chg | -9.7 | -8.3 | 0.0 |
| % chg from peak (peak) | -12.3 (July 17) | -8.7 (Nov 17) | na |
| Adelaide | Perth | Hobart | |
| %chg mth | -0.3 | -1.1 | -0.2 |
| % ann chg | 0.9 | -5.6 | 7.4 |
| % chg from peak (peak) | na | -16.5 (June 14) | na |
| Darwin | Canberra | Capital cities | |
| %chg mth | -1.7 | 0.2 | -1.2 |
| % ann chg | -3.5 | 3.8 | -6.9 |
| % chg from peak (peak) | -25.8 (May 14) | na | -7.8 (Sep 17) |
This document has been prepared by Arco Advisory, 15 089 512 587, AFS Licence 237 590 FSP Pty Ltd.
The information, opinions, and commentary contained in this document have been sourced from Global Markets Research, a division of Commonwealth Bank of Australia ABN 48 123 123 124 AFSL 234945. Global Markets Research has given Colonial First State Investments Limited ABN 98 002 348 352, AFS Licence 232468 (Colonial First State) its permission to reproduce its information, opinions, and commentary contained in this document and for Colonial First State to authorise third parties to reproduce this document.
This information was first made available to CBA clients on 1 February 2019 in a CBA Global Markets Research report publication titled, ‘January Month in Review’.
This document has been prepared for general information purposes only and is intended to provide a summary of the subject matter covered. It does not purport to be comprehensive or to give advice. The views expressed are the views of Colonial First State at the time of writing and may change over time. This document does not constitute an offer, invitation, investment recommendation or inducement to acquire, hold, vary, or dispose of any financial products.
Colonial First State is a wholly owned subsidiary of the Commonwealth Bank of Australia ABN 48 123 123 124, AFS Licence 234945 (the Bank). Colonial First State is the issuer of super, pension and investment products. The Bank and its subsidiaries do not guarantee the performance of Colonial First State’s products or the repayment of capital for investments.
Colonial First State has given Arco Advisory its permission to reproduce the information, opinions, and commentary contained in this document.
This document may include general advice but does not take into account your individual objectives, financial situation or needs. You should read the relevant Product Disclosure Statement (PDS) carefully and assess whether the information is appropriate for you and consider talking to a financial adviser before making an investment decision. PDSs can be obtained from colonialfirststate.com.au or by calling us on 13 13 36.
Past performance is no indication of future performance. Stocks mentioned are for illustrative purposes only and are not recommendations to you to buy sell or hold these stocks.
This document cannot be used or copied in whole or part without Colonial First State’s express written consent. Copyright © Commonwealth Bank of Australia 2019.